Every MSP has a channel, an inbox folder or a ticket queue that nobody really reads any more. It fills up with alerts all day, most of them nothing, and everyone has quietly learned to scroll past. Then one morning a server has been out of disk space since Saturday, and the alert that said so is sitting on page three.
That's alert fatigue. It isn't a people problem. It's what happens when monitoring is switched on with default settings and never tuned, and the fix is mostly housekeeping.
Where the noise comes from
The same few causes turn up in every noisy alert feed.
- Thresholds set too low. CPU above 80% for one sample fires on every Windows Update, every antivirus scan and every Monday morning login storm.
- No duration. A spike that lasts ten seconds isn't a problem. Alerting on it teaches people that alerts don't mean anything.
- Flapping checks. A disk sitting at 85% goes over the line, back under, over again. Each crossing is a new alert and a new email.
- Duplicates. The same problem raises a fresh alert every time it's seen, so one full disk becomes forty tickets.
- Alerts nobody owns. It fires into a shared mailbox, everyone assumes someone else has it, and nobody does.
- Alerts nobody would act on. A workstation went offline at 17:30. Of course it did, it's a workstation.
The last one is the most important. If the honest answer to "what would you do about this?" is "nothing", it shouldn't be an alert.
Every alert needs an action and an owner
Before tuning a single threshold, go through what you alert on and ask two questions of each rule: what does someone do when this fires, and who is that someone?
If there's no action, it's information. Put it on a dashboard or a monthly report, not in front of a tech. If there's an action but no owner, give it a queue or a person before you switch it on. A rule that passes both questions has earned its place.
Use severity levels properly
Three levels is plenty, as long as they mean something different:
- Info: worth knowing, never worth interrupting anyone. A reboot that's been pending for a week.
- Warning: needs doing today or this week. A disk heading for full, a certificate expiring in a fortnight.
- Critical: needs doing now. A server offline, a disk that's full, a core service stopped.
Then let severity drive the route. Critical can page someone. Warnings go to a queue during working hours. Info goes nowhere except the list. The moment everything is critical, you're back to scrolling past.
Thresholds and durations that match reality
Good thresholds come from asking when a human would genuinely want to know. "CPU above 90% for 10 minutes" is a problem. "CPU above 80% once" is Tuesday.
- Add a duration to every metric threshold, so short spikes never fire.
- Give servers and workstations different rules. Servers going offline is critical; workstations going offline at night is normal.
- Add a clearing point below the threshold, so a value hovering on the line doesn't flap open and closed.
- Let a warning escalate into a critical as things get worse, rather than raising two separate alerts for the same disk.
One problem, one alert
Deduplication is the single biggest noise cut most MSPs can make. When the same problem is seen again, it should add to the existing alert, not open a new one. A count and a "last seen" time tell you it's still happening without burying everything else.
The same goes for tickets. One problem should be one ticket, with repeat occurrences added to it, not a fresh ticket every five minutes.
Plan for the noise you cause yourself
A surprising amount of alert noise is self-inflicted: patching nights, planned restarts, a server move you scheduled last week. Maintenance windows hold alerts back during that work, and short mutes cover the known issue someone is already fixing. The key is that suppression should be temporary and visible, so a mute from March isn't still hiding a real problem in October.
Let alerts clear themselves
If a disk drops back below its threshold or an offline server comes back, the alert should resolve on its own. So should the ticket it opened, as long as nobody has already started talking to the customer about it.
Only actionable alerts become tickets
Not every alert needs a ticket. A sensible starting point: ignore info, turn critical into tickets, and decide source by source what happens to warnings. Tickets are where work gets tracked and timed against SLAs, so every alert you let in there should be one somebody will actually work. We wrote more about that in SLAs that mean something.
Review the noisiest alerts every month
Tuning isn't a one-off. Once a month, sort the last month's alerts by count and look at the top ten. For each one, decide: fix the underlying problem, raise the threshold, add a duration, move it to a different severity, or switch it off. Half an hour a month keeps the feed honest.
How we handle it in Tenvara
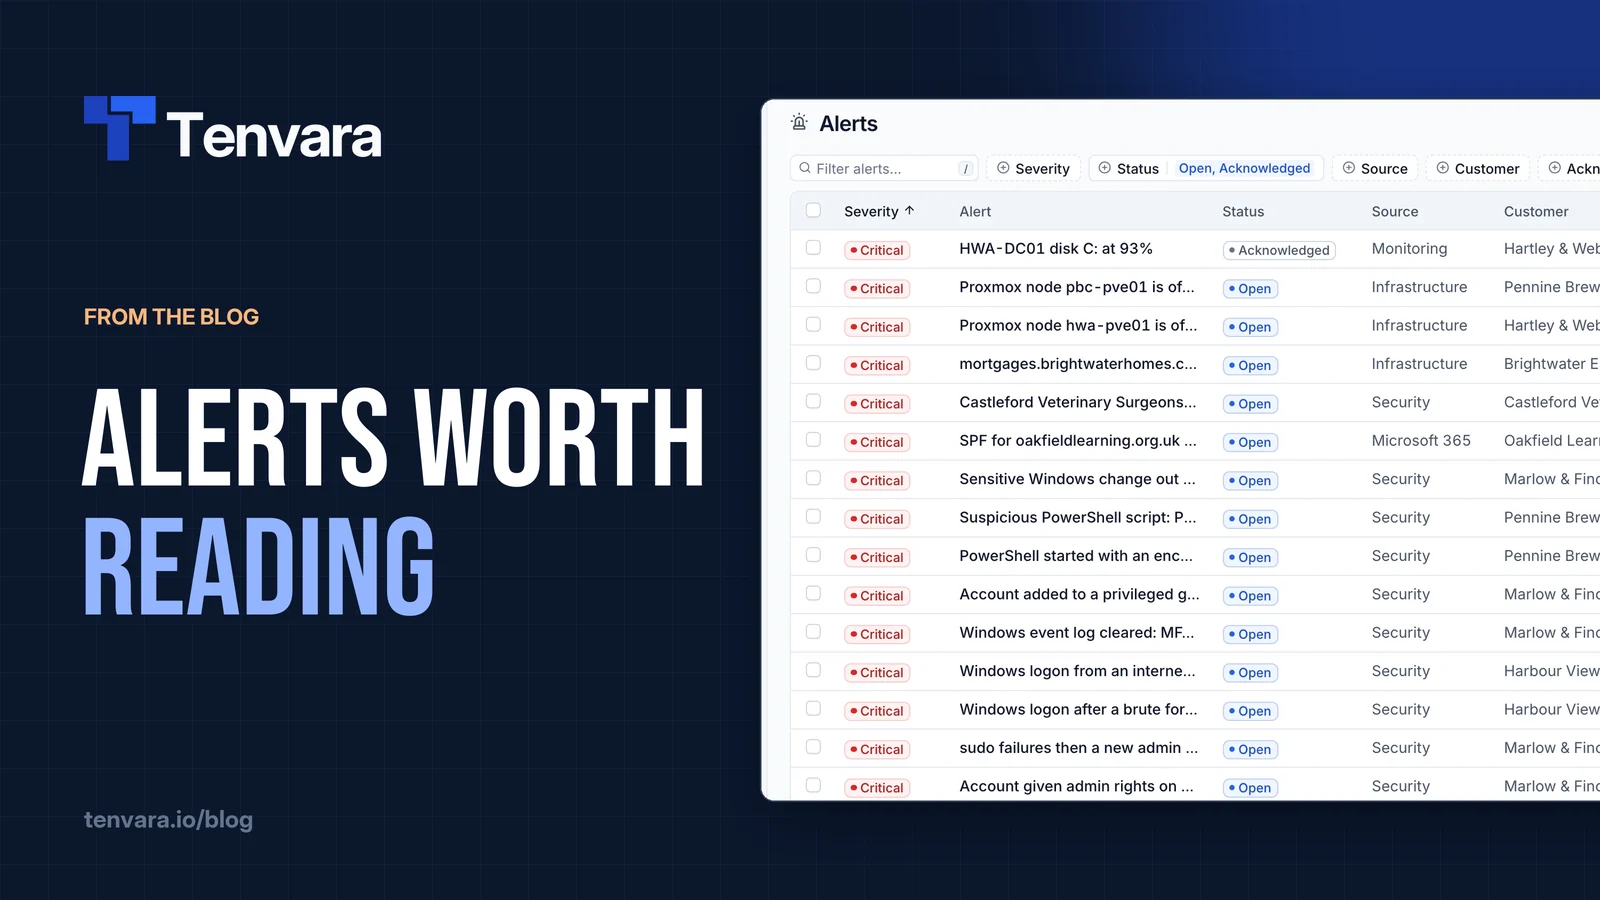
In Tenvara, alerts from every source land in one alert list: monitoring, patching, backup, Microsoft 365, security, infrastructure, printers and more. Each problem has one alert. When it's seen again, Count goes up and Last seen moves on, and when a disk goes from warning to critical, the same alert changes severity rather than opening another. Monitoring alerts resolve themselves when the device's own data shows the problem has gone.
Thresholds live in monitoring policies that apply from a global default down to customers, device groups and single devices, with the most specific winning. Every metric threshold has a For at least duration and a clearing point so values on the line don't flap, and each rule is Info, Warning or Critical. Offline alerts can be switched off per policy, which is exactly what you want for workstations that go home at night.
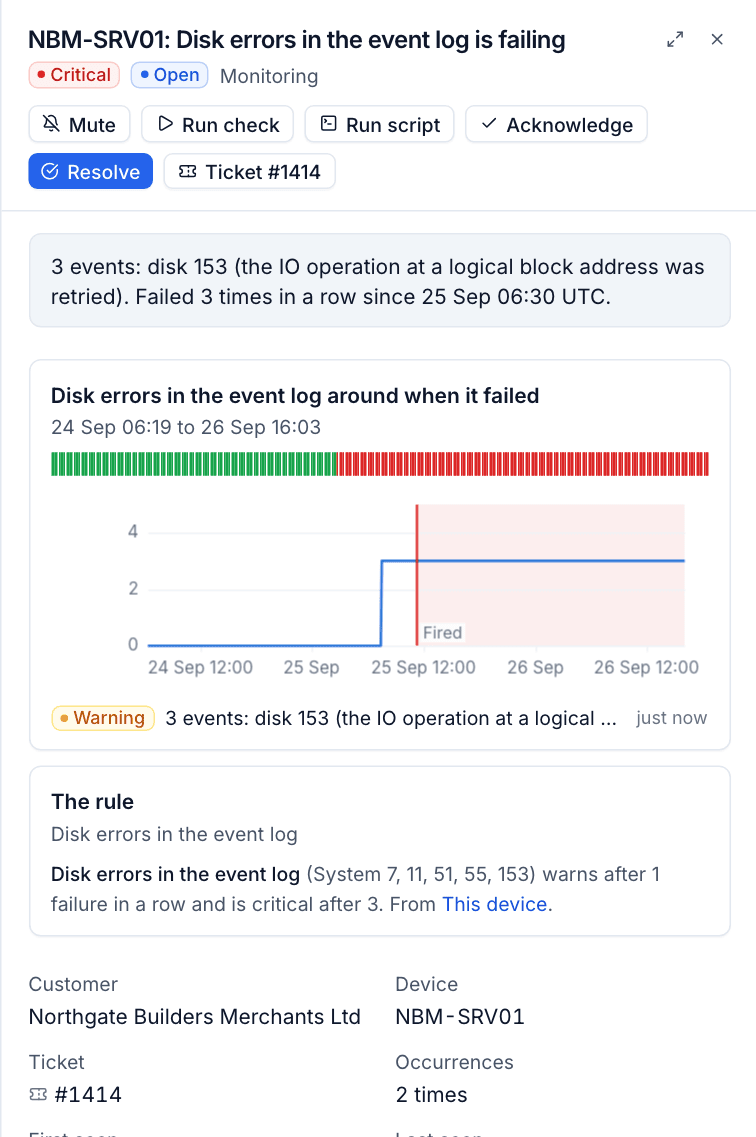
Open an alert and you see the chart around when it fired, the rule behind it in plain words and the policy it came from, so tuning a noisy rule is one click away. Maintenance windows and mutes hold alerts back during planned work without losing anything, and Muted now in settings lists every mute with who set it and why.
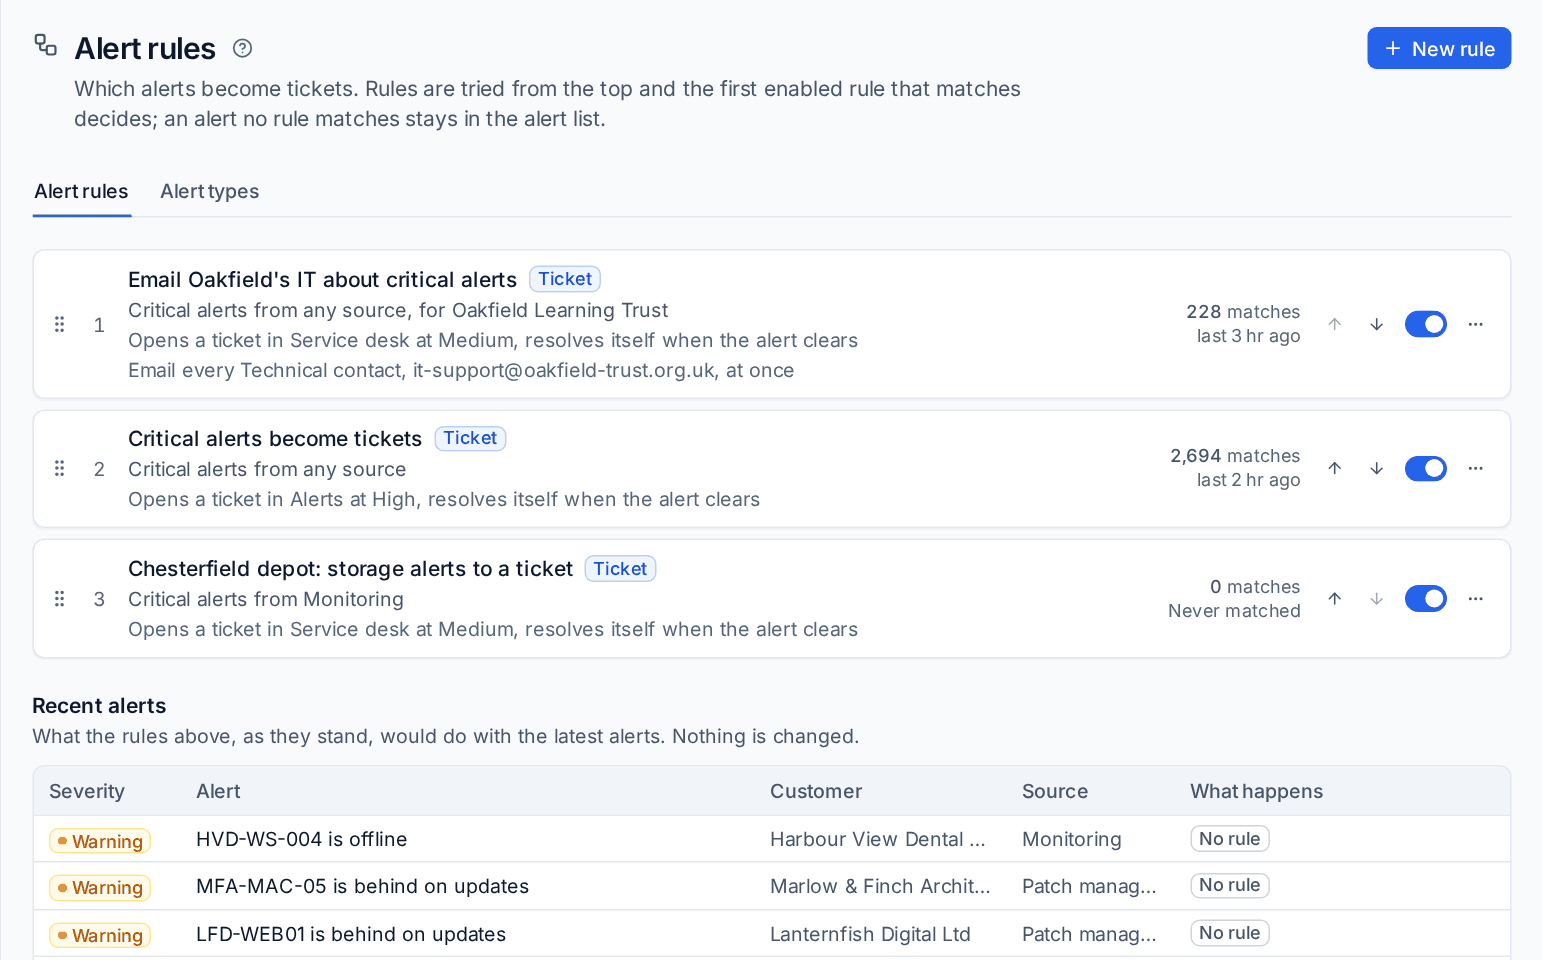
Alert rules decide which alerts become tickets: match on source, severity and customer, then open a ticket in a chosen queue at a chosen priority, or ignore the alert. Tick one box and the ticket resolves itself when the alert clears. Before you save, Test against recent alerts shows what the rule would have caught.
For the alerts that really can't wait, each person chooses how critical alerts reach them (inbox, email, Teams, Slack or text) with quiet hours, and on-call rotas page whoever is on call and escalate if nobody acknowledges. The RMM page shows how monitoring fits alongside the rest.
Quiet is the goal
A good alert feed is a quiet one, where anything that does appear is worth reading. Tune it once, review it monthly, and your techs will start trusting their alerts again. Tenvara is launching soon: if you'd like to try it against your own devices, get early access and apply for the beta.